
- Start >
- Rivers >
- Waterlevel >
- Untere Donau >
- Hörmannsberg >
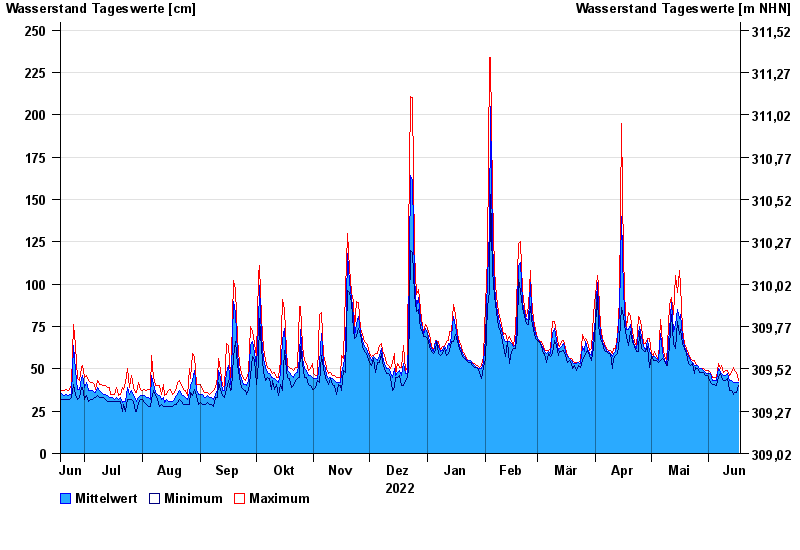
- Chart of year

Chart of year Hörmannsberg / Gaißa
Waterlevel from 18.06.2022 to 17.06.2023
 Für diesen Pegel sind keine Hochwassermarken hinterlegt.
| Date | Mean value [cm] | Maximum [cm] | Minimum [cm] |
|---|---|---|---|
| 17.06.2023 | 42 | 43 | 40 |
| 16.06.2023 | 42 | 48 | 36 |
| 15.06.2023 | 42 | 49 | 36 |
| 14.06.2023 | 42 | 51 | 35 |
| 13.06.2023 | 43 | 48 | 37 |
| 12.06.2023 | 43 | 46 | 37 |
| 11.06.2023 | 47 | 49 | 44 |
© Bayerisches Landesamt für Umwelt 2024