
- Start >
- Rivers >
- Waterlevel >
- Untere Donau >
- Hörmannsberg >
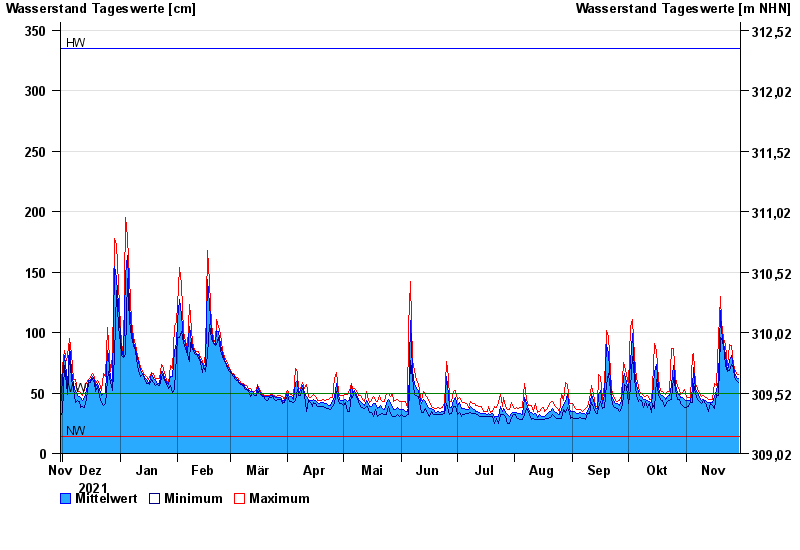
- Chart of year

Chart of year Hörmannsberg / Gaißa
Waterlevel from 30.11.2021 to 29.11.2022
| Date | Mean value [cm] | Maximum [cm] | Minimum [cm] |
|---|---|---|---|
| 29.11.2022 | 62 | 65 | 59 |
| 28.11.2022 | 63 | 66 | 60 |
| 27.11.2022 | 67 | 70 | 63 |
| 26.11.2022 | 72 | 74 | 70 |
| 25.11.2022 | 81 | 89 | 74 |
| 24.11.2022 | 77 | 90 | 69 |
| 23.11.2022 | 69 | 73 | 68 |
© Bayerisches Landesamt für Umwelt 2024