
- Start >
- Rivers >
- Waterlevel >
- Untere Donau >
- Köfering >
- Chart of year

Chart of year Köfering / Pfatter
Waterlevel from 01.12.2021 to 30.11.2022
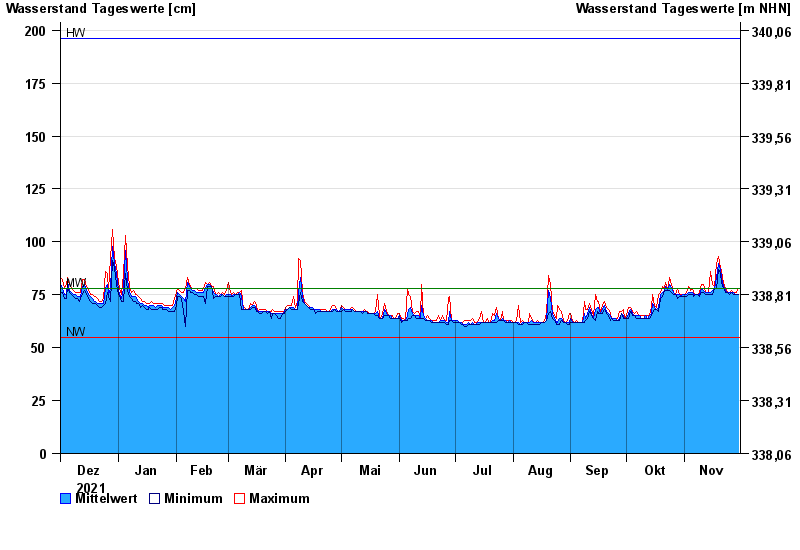
| Date | Mean value [cm] | Maximum [cm] | Minimum [cm] |
|---|---|---|---|
| 30.11.2022 | 75 | 78 | 75 |
| 29.11.2022 | 75 | 76 | 75 |
| 28.11.2022 | 75 | 76 | 75 |
| 27.11.2022 | 76 | 76 | 75 |
| 26.11.2022 | 76 | 77 | 76 |
| 25.11.2022 | 76 | 76 | 75 |
| 24.11.2022 | 76 | 76 | 76 |
© Bayerisches Landesamt für Umwelt 2024