
- Start >
- Rivers >
- Waterlevel >
- Untere Donau >
- Kollbach >
- Chart of year

Chart of year Kollbach / Kollbach
Waterlevel from 30.03.2024 to 29.03.2025
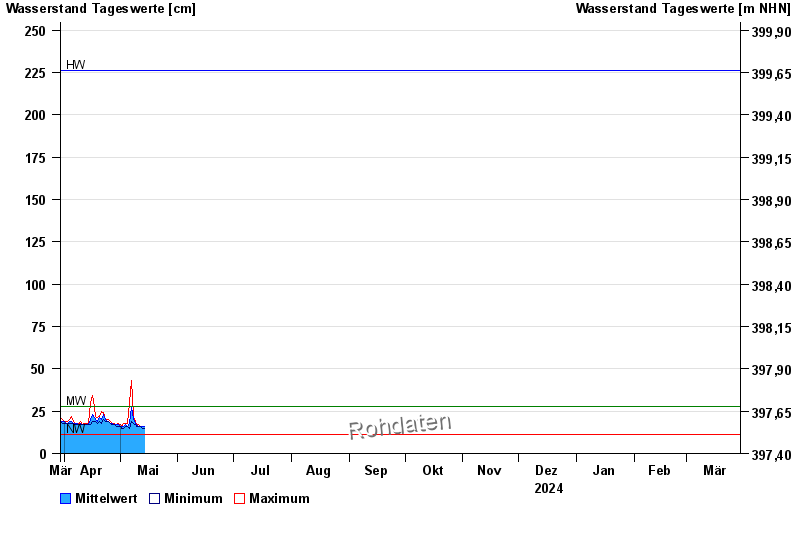
| Date | Mean value [cm] | Maximum [cm] | Minimum [cm] |
|---|---|---|---|
| 14.09.2024 | 130 | 193 | 64 |
| 13.09.2024 | 33 | 63 | 19 |
| 12.09.2024 | 24 | 28 | 18 |
| 11.09.2024 | 18 | 21 | 17 |
| 10.09.2024 | 21 | 24 | 18 |
| 09.09.2024 | 28 | 39 | 15 |
| 08.09.2024 | 14 | 15 | 13 |
© Bayerisches Landesamt für Umwelt 2024