
- Start >
- Rivers >
- Waterlevel >
- Untere Donau >
- Kothmaißling >
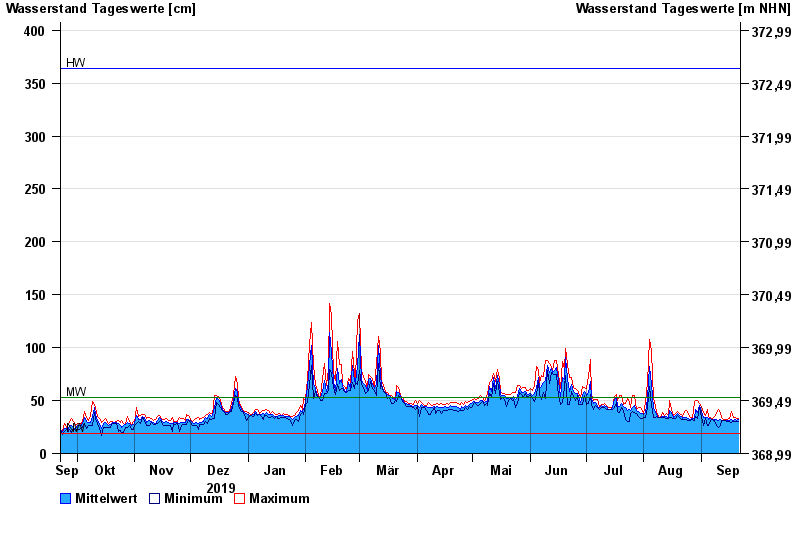
- Chart of year

Chart of year Kothmaißling / Chamb
Waterlevel from 22.09.2019 to 21.09.2020
note
Beeinflussung durch Buhneneinbau unterhalb vom Pegel
| Date | Mean value [cm] | Maximum [cm] | Minimum [cm] |
|---|---|---|---|
| 21.09.2020 | 32 | 33 | 30 |
| 20.09.2020 | 31 | 33 | 30 |
| 19.09.2020 | 32 | 34 | 30 |
| 18.09.2020 | 31 | 34 | 30 |
| 17.09.2020 | 32 | 40 | 29 |
| 16.09.2020 | 31 | 33 | 30 |
| 15.09.2020 | 31 | 32 | 30 |
© Bayerisches Landesamt für Umwelt 2024