
- Start >
- Rivers >
- Waterlevel >
- Untere Donau >
- Mühldorf >
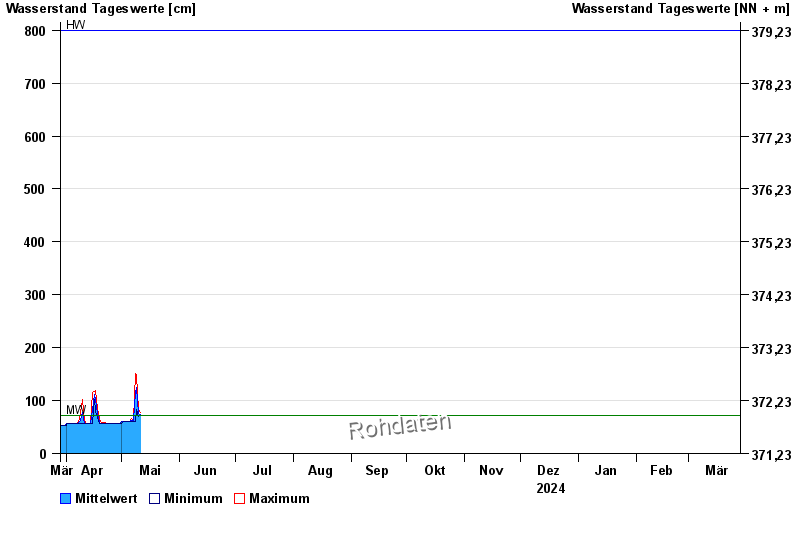
- Chart of year

Chart of year Mühldorf / Inn
Waterlevel from 29.03.2024 to 28.03.2025
| Date | Mean value [cm] | Maximum [cm] | Minimum [cm] |
|---|---|---|---|
| 30.06.2024 | 234 | 242 | 225 |
| 29.06.2024 | 240 | 270 | 210 |
| 28.06.2024 | 233 | 250 | 209 |
| 27.06.2024 | 255 | 268 | 241 |
| 26.06.2024 | 247 | 275 | 219 |
| 25.06.2024 | 240 | 262 | 225 |
| 24.06.2024 | 275 | 305 | 247 |
© Bayerisches Landesamt für Umwelt 2024