
- Start >
- Rivers >
- Waterlevel >
- Untere Donau >
- Mühldorf >
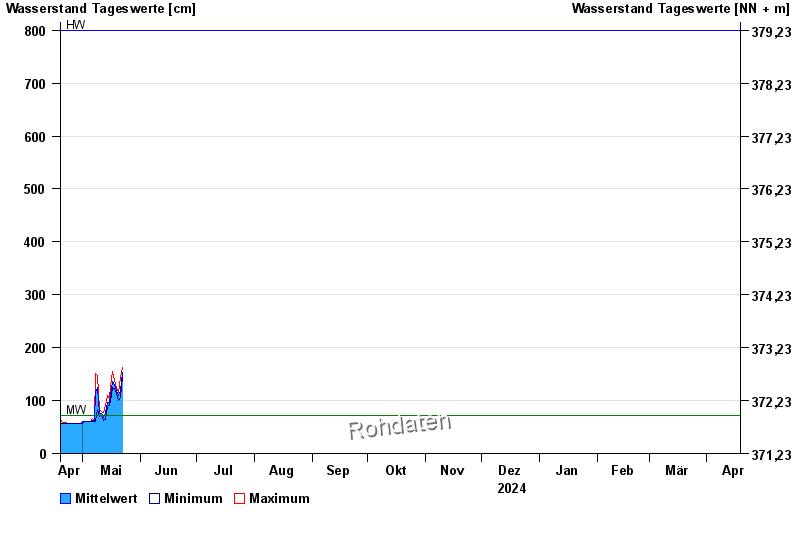
- Chart of year

Chart of year Mühldorf / Inn
Waterlevel from 19.04.2024 to 18.04.2025
| Date | Mean value [cm] | Maximum [cm] | Minimum [cm] |
|---|---|---|---|
| 19.10.2024 | 78 | 109 | 59 |
| 18.10.2024 | 84 | 97 | 73 |
| 17.10.2024 | 66 | 84 | 54 |
| 16.10.2024 | 108 | 127 | 85 |
| 15.10.2024 | 133 | 143 | 117 |
| 14.10.2024 | 117 | 123 | 108 |
| 13.10.2024 | 128 | 148 | 112 |
© Bayerisches Landesamt für Umwelt 2024