
- Start >
- Rivers >
- Waterlevel >
- Untere Donau >
- Ösbühl >
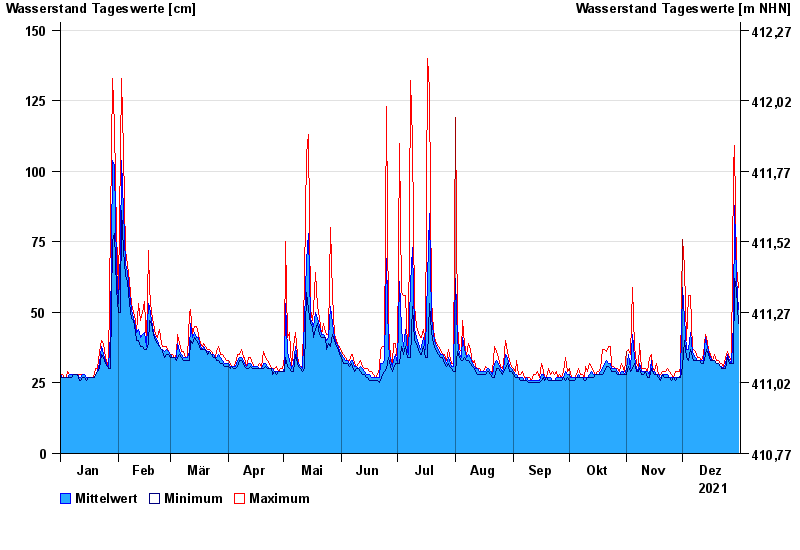
- Chart of year

Chart of year Ösbühl / Danglesbach
Waterlevel from 01.01.2021 to 31.12.2021
- 21.12.1993 Wasserstand: 175 cm
- 01.11.1998 Wasserstand: 174 cm
- 26.01.1995 Wasserstand: 174 cm
- 26.02.1997 Wasserstand: 167 cm
- 17.09.2016 Wasserstand: 164 cm
| Date | Mean value [cm] | Maximum [cm] | Minimum [cm] |
|---|---|---|---|
| 31.12.2021 | 51 | 59 | 46 |
| 30.12.2021 | 62 | 66 | 58 |
| 29.12.2021 | 88 | 109 | 62 |
| 28.12.2021 | 46 | 101 | 32 |
| 27.12.2021 | 32 | 33 | 32 |
| 26.12.2021 | 33 | 34 | 32 |
| 25.12.2021 | 35 | 36 | 34 |
© Bayerisches Landesamt für Umwelt 2025