
- Start >
- Rivers >
- Waterlevel >
- Untere Donau >
- Panzing >
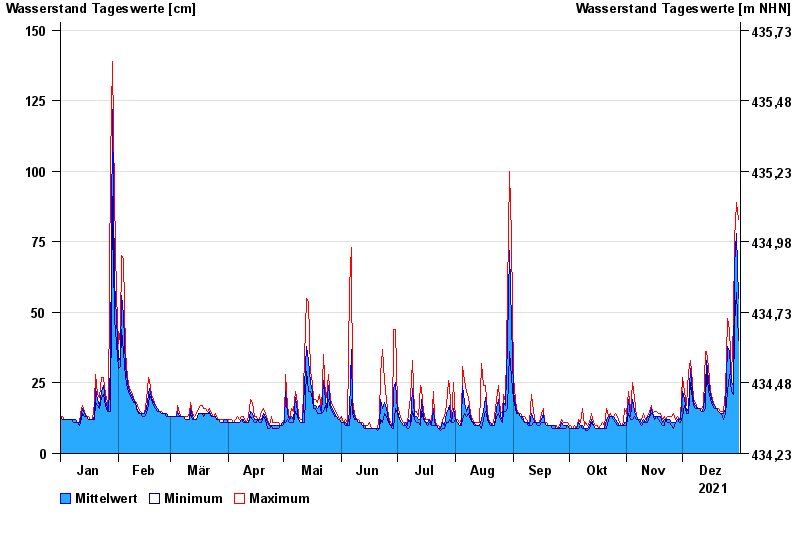
- Chart of year

Chart of year Panzing / Bina
Waterlevel from 01.01.2021 to 31.12.2021
- Hochwassergefahrenfläche HQ100 230 cm
| Date | Mean value [cm] | Maximum [cm] | Minimum [cm] |
|---|---|---|---|
| 31.12.2021 | 55 | 83 | 40 |
| 30.12.2021 | 78 | 89 | 57 |
| 29.12.2021 | 67 | 76 | 46 |
| 28.12.2021 | 24 | 46 | 21 |
| 27.12.2021 | 25 | 28 | 22 |
| 26.12.2021 | 36 | 44 | 28 |
| 25.12.2021 | 38 | 48 | 22 |
© Bayerisches Landesamt für Umwelt 2025