
- Start >
- Rivers >
- Waterlevel >
- Untere Donau >
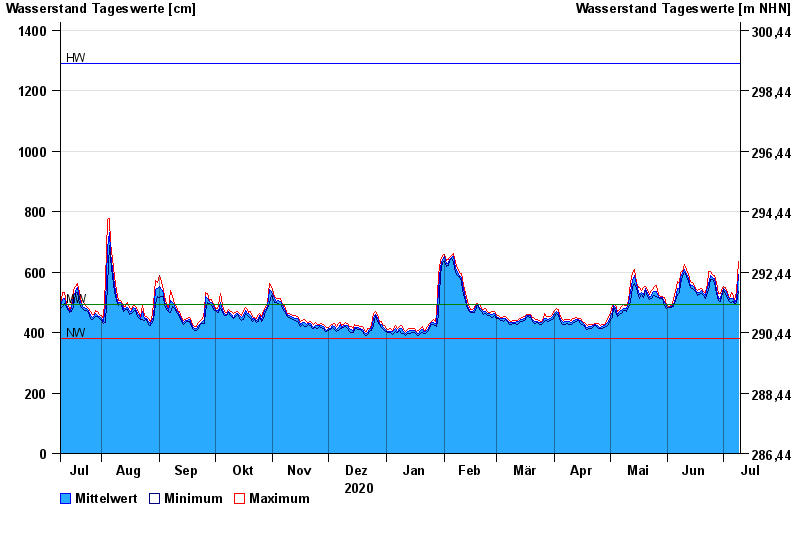
- Passau >
- Chart of year

Chart of year Passau / Donau
Waterlevel from 10.07.2020 to 09.07.2021
| Date | Mean value [cm] | Maximum [cm] | Minimum [cm] |
|---|---|---|---|
| 09.07.2021 | 591 | 635 | 537 |
| 08.07.2021 | 510 | 537 | 501 |
| 07.07.2021 | 498 | 505 | 492 |
| 06.07.2021 | 512 | 521 | 502 |
| 05.07.2021 | 513 | 532 | 499 |
| 04.07.2021 | 508 | 514 | 503 |
| 03.07.2021 | 525 | 532 | 512 |
© Bayerisches Landesamt für Umwelt 2024