
- Start >
- Rivers >
- Waterlevel >
- Untere Donau >
- Schwandorf >
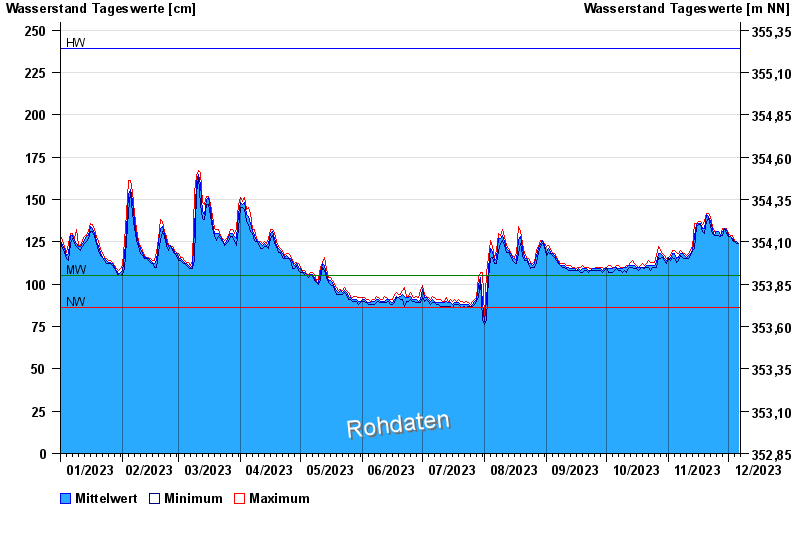
- Chart of year

Chart of year Schwandorf / Naab
Waterlevel from 01.01.2023 to 06.12.2023
note
Pegel bis auf Weiteres außer Betrieb wegen Brückenbauarbeiten.
Date | Mean value [cm] | Maximum [cm] | Minimum [cm] |
|---|---|---|---|
| 06.12.2023 | 124 | 124 | 124 |
| 05.12.2023 | 125 | 125 | 124 |
| 04.12.2023 | 125 | 126 | 125 |
| 03.12.2023 | 127 | 129 | 126 |
| 02.12.2023 | 128 | 129 | 128 |
| 01.12.2023 | 129 | 130 | 128 |
| 30.11.2023 | 132 | 133 | 130 |
© Bayerisches Landesamt für Umwelt 2025