
- Start >
- Rivers >
- Waterlevel >
- Regnitz >
- Büg >
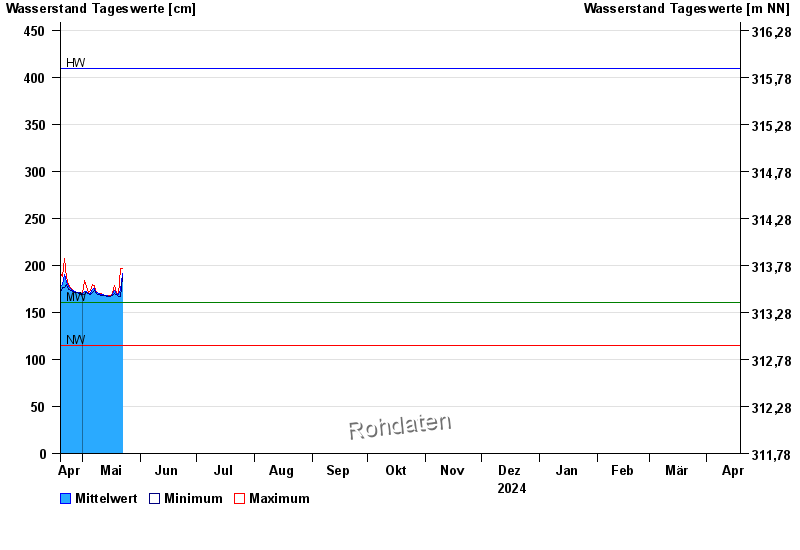
- Chart of year

Chart of year Büg / Schwabach
Waterlevel from 19.04.2024 to 18.04.2025
| Date | Mean value [cm] | Maximum [cm] | Minimum [cm] |
|---|---|---|---|
| 26.06.2024 | 170 | 173 | 167 |
| 25.06.2024 | 172 | 173 | 171 |
| 24.06.2024 | 173 | 174 | 172 |
| 23.06.2024 | 173 | 174 | 173 |
| 22.06.2024 | 175 | 178 | 173 |
| 21.06.2024 | 175 | 176 | 174 |
| 20.06.2024 | 174 | 174 | 173 |
© Bayerisches Landesamt für Umwelt 2024