
- Start >
- Rivers >
- Waterlevel >
- Regnitz >
- Emskirchen >
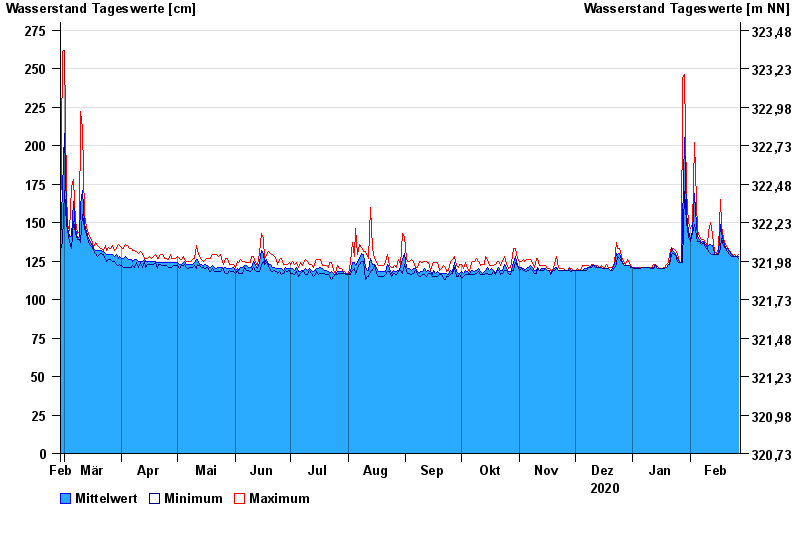
- Chart of year

Chart of year Emskirchen / Mittlere Aurach
Waterlevel from 28.02.2020 to 27.02.2021
note
Wasserstand und Abfluss wird zeitweise durch Biberdamm beeinflusst.
| Date | Mean value [cm] | Maximum [cm] | Minimum [cm] |
|---|---|---|---|
| 27.02.2021 | 128 | 129 | 127 |
| 26.02.2021 | 128 | 128 | 128 |
| 25.02.2021 | 128 | 129 | 128 |
| 24.02.2021 | 128 | 128 | 128 |
| 23.02.2021 | 129 | 130 | 128 |
| 22.02.2021 | 131 | 132 | 129 |
| 21.02.2021 | 133 | 134 | 131 |
© Bayerisches Landesamt für Umwelt 2024