
- Start >
- Rivers >
- Waterlevel >
- Regnitz >
- Emskirchen >
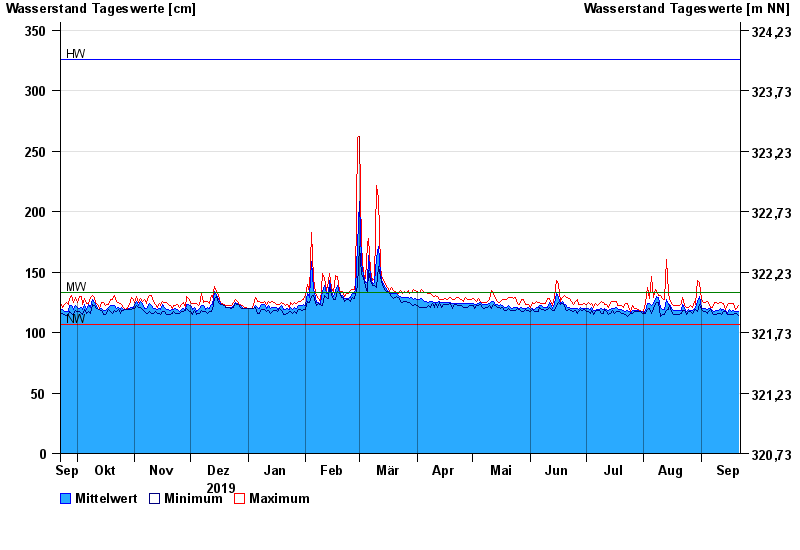
- Chart of year

Chart of year Emskirchen / Mittlere Aurach
Waterlevel from 22.09.2019 to 21.09.2020
note
Wasserstand und Abfluss wird zeitweise durch Biberdamm beeinflusst.
| Date | Mean value [cm] | Maximum [cm] | Minimum [cm] |
|---|---|---|---|
| 21.09.2020 | 117 | 122 | 114 |
| 20.09.2020 | 117 | 120 | 116 |
| 19.09.2020 | 117 | 119 | 116 |
| 18.09.2020 | 118 | 124 | 115 |
| 17.09.2020 | 117 | 124 | 115 |
| 16.09.2020 | 119 | 124 | 115 |
| 15.09.2020 | 116 | 123 | 115 |
© Bayerisches Landesamt für Umwelt 2024