
- Start >
- Rivers >
- Waterlevel >
- Regnitz >
- Hollfeld >
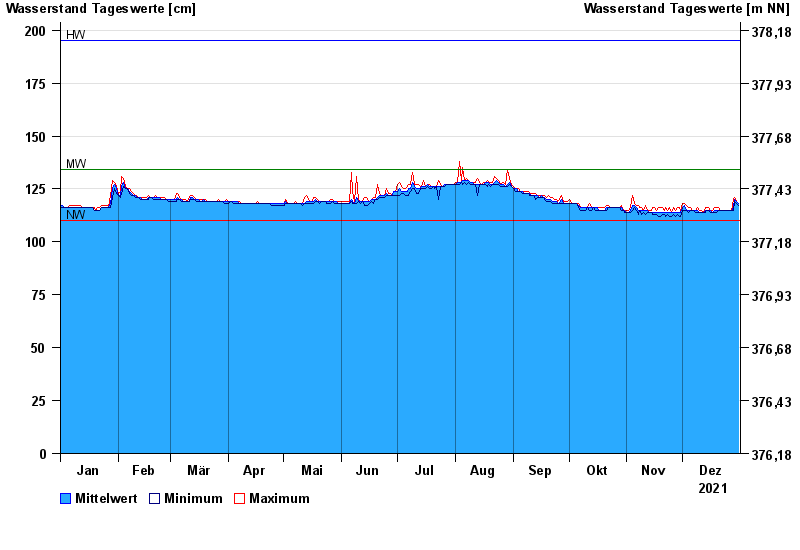
- Chart of year

Chart of year Hollfeld / Wiesent
Waterlevel from 01.01.2021 to 31.12.2021
| Date | Mean value [cm] | Maximum [cm] | Minimum [cm] |
|---|---|---|---|
| 31.12.2021 | 118 | 118 | 117 |
| 30.12.2021 | 119 | 119 | 118 |
| 29.12.2021 | 120 | 121 | 119 |
| 28.12.2021 | 116 | 120 | 115 |
| 27.12.2021 | 115 | 115 | 115 |
| 26.12.2021 | 115 | 115 | 115 |
| 25.12.2021 | 115 | 115 | 115 |
© Bayerisches Landesamt für Umwelt 2025