
- Start >
- Rivers >
- Waterlevel >
- Regnitz >
- Illesheim >
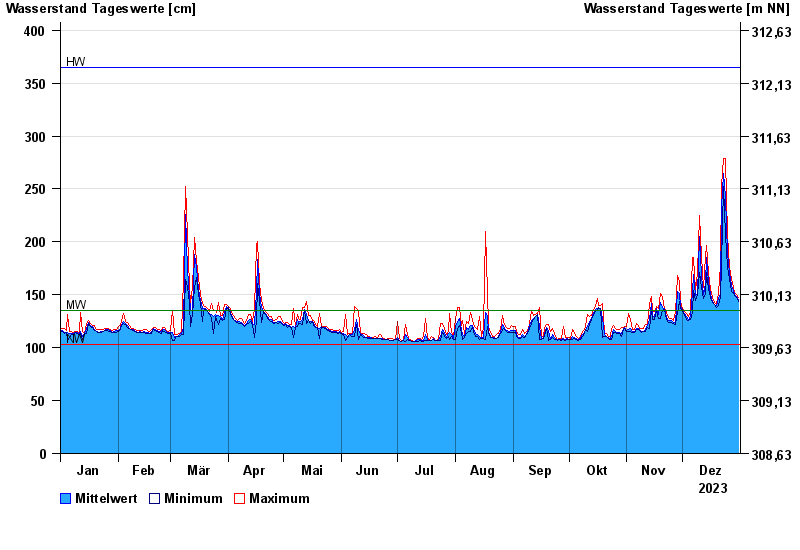
- Chart of year

Chart of year Illesheim / Aisch
Waterlevel from 01.01.2023 to 31.12.2023
note
Wasserstand und Abfluss wird zeitweise durch Biberdamm beeinflusst.
| Date | Mean value [cm] | Maximum [cm] | Minimum [cm] |
|---|---|---|---|
| 31.12.2023 | 145 | 147 | 144 |
| 30.12.2023 | 148 | 150 | 147 |
| 29.12.2023 | 150 | 152 | 149 |
| 28.12.2023 | 154 | 157 | 152 |
| 27.12.2023 | 159 | 164 | 153 |
| 26.12.2023 | 170 | 177 | 164 |
| 25.12.2023 | 189 | 206 | 177 |
© Bayerisches Landesamt für Umwelt 2025