
- Start >
- Rivers >
- Waterlevel >
- Regnitz >
- Illesheim >
- Chart of year

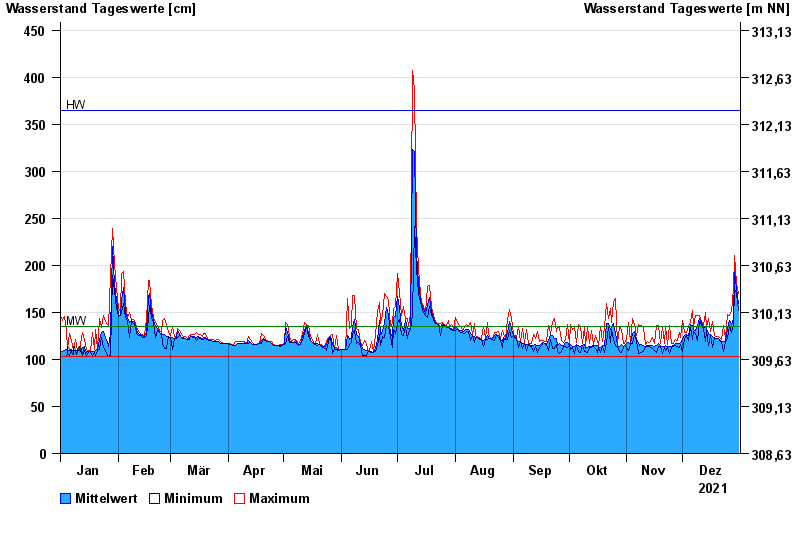
Chart of year Illesheim / Aisch
Waterlevel from 01.01.2021 to 31.12.2021
note
Wasserstand und Abfluss wird zeitweise durch Biberdamm beeinflusst.
| Date | Mean value [cm] | Maximum [cm] | Minimum [cm] |
|---|---|---|---|
| 31.12.2021 | 159 | 170 | 152 |
| 30.12.2021 | 175 | 181 | 170 |
| 29.12.2021 | 194 | 211 | 175 |
| 28.12.2021 | 144 | 175 | 137 |
| 27.12.2021 | 137 | 151 | 129 |
| 26.12.2021 | 141 | 147 | 136 |
| 25.12.2021 | 133 | 148 | 122 |
© Bayerisches Landesamt für Umwelt 2025