
- Start >
- Rivers >
- Waterlevel >
- Regnitz >
- Reichenbach >
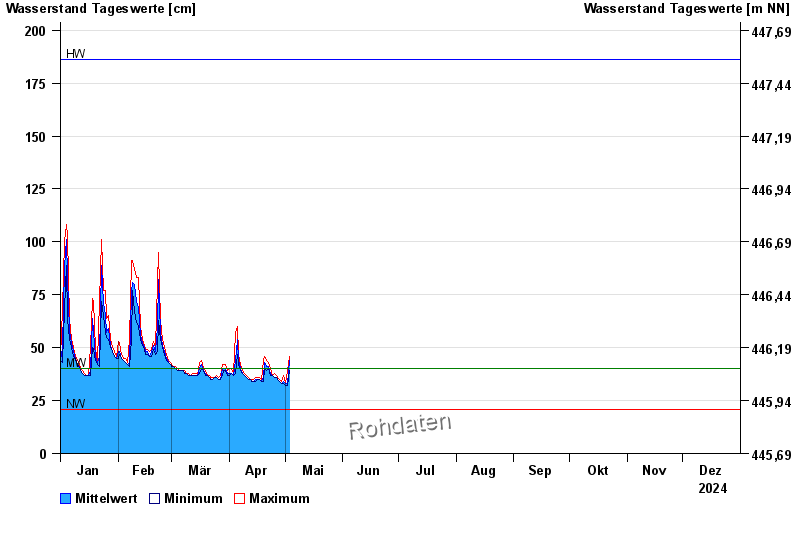
- Chart of year

Chart of year Reichenbach / Wörnitz
Waterlevel from 01.01.2024 to 31.12.2024
| Date | Mean value [cm] | Maximum [cm] | Minimum [cm] |
|---|---|---|---|
| 16.10.2024 | 64 | 72 | 57 |
| 15.10.2024 | 88 | 97 | 73 |
| 14.10.2024 | 44 | 73 | 37 |
| 13.10.2024 | 40 | 41 | 38 |
| 12.10.2024 | 45 | 55 | 40 |
| 11.10.2024 | 49 | 56 | 36 |
| 10.10.2024 | 36 | 37 | 35 |
© Bayerisches Landesamt für Umwelt 2024