
- Start >
- Rivers >
- Waterlevel >
- Regnitz >
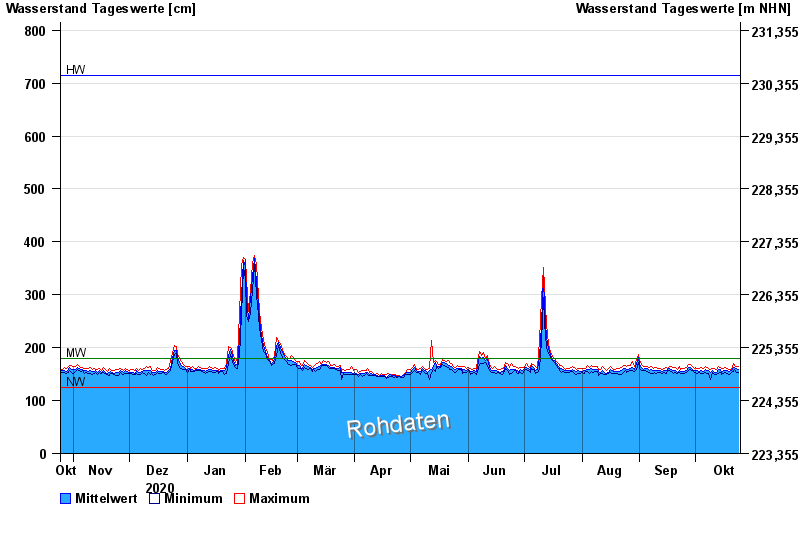
- Trunstadt >
- Chart of year

Chart of year Trunstadt / Main
Waterlevel from 25.10.2020 to 24.10.2021
| Date | Mean value [cm] | Maximum [cm] | Minimum [cm] |
|---|---|---|---|
| 24.10.2021 | 158 | 164 | 153 |
| 23.10.2021 | 159 | 165 | 154 |
| 22.10.2021 | 162 | 166 | 158 |
| 21.10.2021 | 163 | 170 | 155 |
| 20.10.2021 | 156 | 159 | 153 |
| 19.10.2021 | 155 | 158 | 150 |
| 18.10.2021 | 156 | 161 | 150 |
© Bayerisches Landesamt für Umwelt 2024