
- Start >
- Rivers >
- Watertemperature >
- Inn >
- Feldolling >
- Chart of year

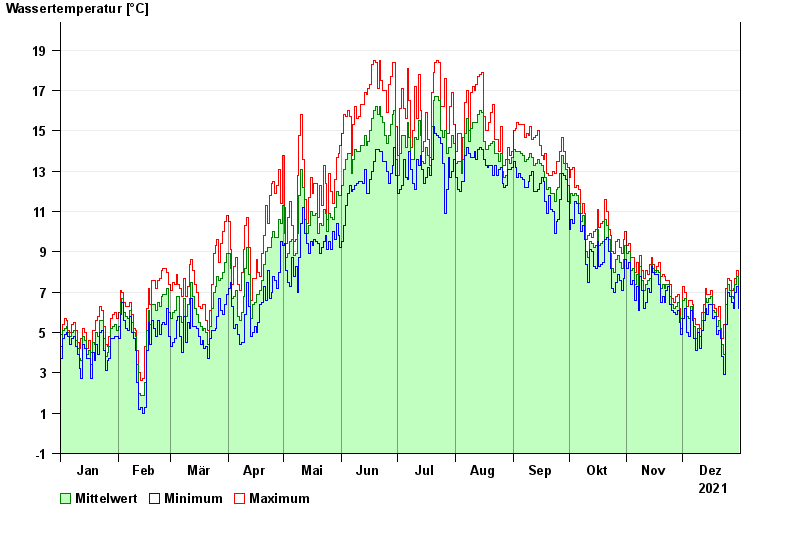
Chart of year Feldolling / Mangfall
Water temperature from 01.01.2021 to 31.12.2021
| Date | Water temperature [°C] | Maximum [°C] | Minimum [°C] |
|---|---|---|---|
| 31.12.2021 | 6.8 | 7.3 | 6.2 |
| 30.12.2021 | 7.8 | 8.1 | 7.3 |
| 29.12.2021 | 7.4 | 7.7 | 7.0 |
| 28.12.2021 | 6.7 | 7.2 | 6.2 |
| 27.12.2021 | 6.8 | 7.1 | 6.5 |
| 26.12.2021 | 7.1 | 7.6 | 6.8 |
| 25.12.2021 | 7.4 | 7.7 | 7.0 |
© Bayerisches Landesamt für Umwelt 2025